

How Integrators Should Read an LED Specification Sheet
November 16, 2026Headline figures establish a baseline, but the component-level decisions behind them reveal whether a display fits the complete project.
Jovani Torres, Strategic Business Developer for the High Bright team
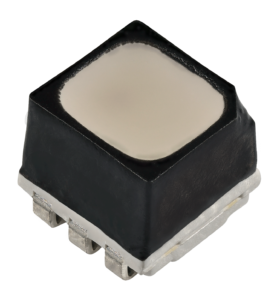
For integrators, an LED specification sheet provides a necessary but limited view of display performance. The document captures stated results under defined conditions, but it rarely explains how the display reached those figures, or whether competing products were measured the same way. Every number on that sheet also has specs behind the specs. Specifically, display manufacturers publish the figures, but the LED components they build on determine what those figures can be. Cree LED’s work on OptiLamp™ LEDs explains why the mechanism behind a specification, and where it originates, can be as relevant as the reported result.
Brightness provides a logical starting point because it is one of the most visible figures on the sheet. Maximum output, however, is only one part of the evaluation. Integrators should request power draw at the project’s target brightness, determine whether the reported figure is typical or peak and identify the test content used. A high maximum can provide operating headroom, but project planning depends on the required output, the energy needed to produce it and the cost of sustaining it.
The relationship between brightness and energy use makes power the next figure to examine. Component brightness, pixel pitch, scanning mode and typical content play the greatest role in connecting raw brightness to a reported power draw, and because display panels and installations come in so many different layouts, that figure is best normalized by area into the commonly used watts per square meter (W/m²) — a comparison that only holds when display area, brightness, content and operating mode are equivalent. Integrators should determine whether the figure represents all-white content, average video load, or another defined condition, then apply the result to the project’s operating schedule and local electricity rate to convert a component claim into a system-planning input.
Beyond brightness and power, refresh rate and scan rate answer different questions about image control. Refresh rate describes how often image information is updated, while scan rate describes how pixels are addressed. Under direct drive, or a 1:1 scan rate, every pixel has its own control path. OptiLamp places that control within the LED package itself — one of the clearest examples of a display spec originating at the component level rather than in the display’s own design.
For camera-facing installations, the evaluation should include recorded evidence under the intended frame rates and shutter settings. A display that looks stable to the eye can behave differently through a camera, particularly when production conditions vary. Testing should therefore reflect the broadcast, live-event or content-production workflow rather than a generic demonstration loop.
Visual evaluation also extends beyond maximum brightness to the way a display reproduces color. The claims in both areas should include the measurement instrument, its position, display warmup, target coordinates and acceptable tolerances. A high color-depth value indicates control capability, but repeatability against a defined target is a more useful project criterion.
Once visual and electrical performance have been considered, physical specifications add another layer of project context. Weight and depth affect more than shipping because they can influence structural loading, installation labor, access and service. Transparency is not always a standard line on the sheet. Instead, it is more accurately described as a feature that certain architectures enable than a fixed specification, but where it is listed, integrators should confirm how the percentage was calculated and whether the supporting structure is included. Without a stated method, the number can conceal meaningful differences between products.
The review should continue beyond installation and into the display’s service life. Service information is often the least developed part of the sheet, leaving integrators to determine what the system can report before a visible failure, how precisely it can locate a fault and which data reaches the operator. Field-replacement options, spare-component requirements and the effect of a repair on calibration also belong in the discussion because those answers help convert a warranty statement into an operating plan.
Across categories, architecture can help explain why several specifications move together, though it should not be treated as proof on its own. A direct-drive design may give a manufacturer new options for control, physical layout or diagnostics, but the finished product still needs to demonstrate those outcomes. The integrator’s task is to trace each claimed benefit from mechanism to implementation to measurement.
Finally, long-term performance provides another consideration. Integrators should ask what happens to brightness, color and power as the display ages, which performance margins exist at commissioning and how temperature changes are handled. A sheet dominated by day-one maximums may leave the most important ownership questions unanswered.
Taken together, the questions make the specification sheet the start of due diligence rather than the end of it. The figures identify what to investigate, while the component-level decisions behind them, along with supporting methods, operating assumptions and product design, determine whether the display belongs in the project.
© 2026 Cree LED. All rights reserved. Cree®, the Cree logo and the Cree LED logo are registered trademarks of Cree LED. OptiLamp is a trademark of Cree LED. This document is provided for informational purposes only.